
Mastering Graphing in the Coordinate Plane: 4 Quadrants Printable


Understanding the Coordinate Plane
Graphing in the coordinate plane can seem intimidating at first, but with practice and the right resources, it can become second nature. The coordinate plane is a fundamental concept in mathematics, used to plot points and graph lines. It is divided into four quadrants, each with its own unique characteristics. In this article, we will explore the basics of graphing in the coordinate plane and provide a 4 quadrants printable guide to help you practice.
The coordinate plane is a two-dimensional plane with an x-axis and a y-axis. The x-axis runs horizontally, while the y-axis runs vertically. The point where the two axes intersect is called the origin, and it is labeled as (0,0). The four quadrants are labeled as follows: Quadrant I (upper right), Quadrant II (upper left), Quadrant III (lower left), and Quadrant IV (lower right). Understanding the coordinate plane is essential for graphing points and lines.
Practicing with a 4 Quadrants Printable
To graph a point in the coordinate plane, you need to know its x-coordinate and y-coordinate. The x-coordinate tells you how far to move horizontally from the origin, while the y-coordinate tells you how far to move vertically. For example, to graph the point (3,4), you would move 3 units to the right and 4 units up from the origin. With practice, you can become proficient in graphing points and lines in the coordinate plane.
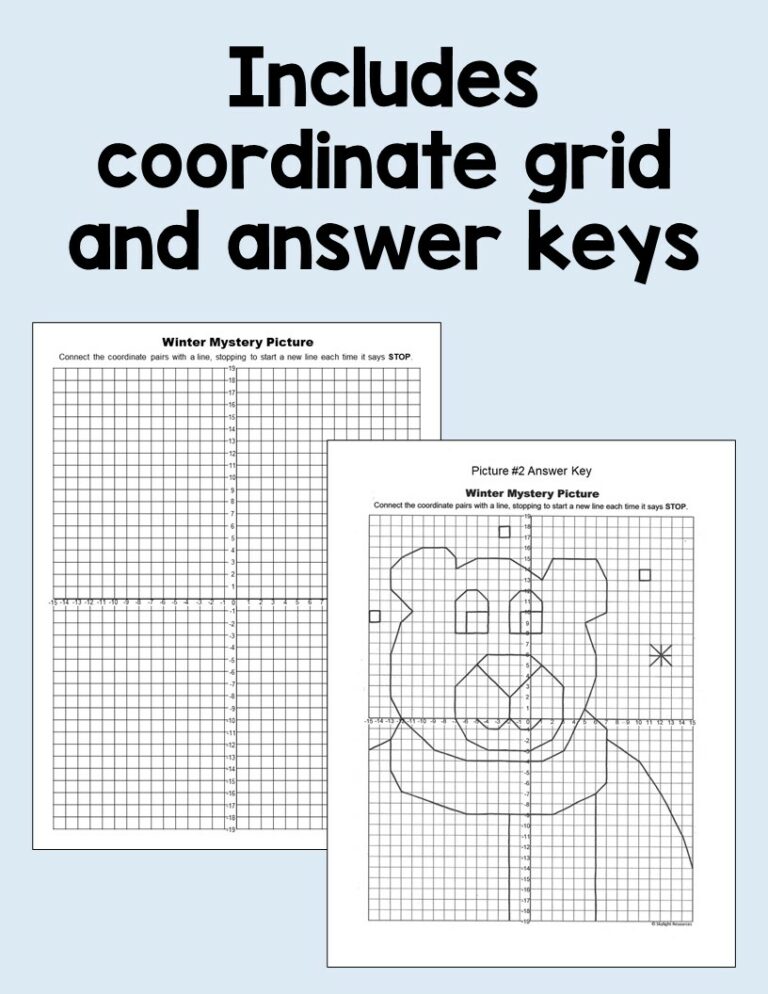
To help you practice graphing in the coordinate plane, we have created a 4 quadrants printable guide. This guide includes a blank coordinate plane with all four quadrants labeled, as well as examples of points to graph. You can download and print out the guide to practice graphing points and lines. With our 4 quadrants printable guide, you can improve your math skills and become more confident in your ability to graph in the coordinate plane.